Professional hockey, like football, basketball, and baseball, is big business. The NHL is seeing record profits and value for their teams – in fact, team values are up 46% from just last year – and that's despite the lockout cancelling 42% of last season's games. In fact, the shortened season contributed to the big gain in value as operating budgets were down. Canadian teams dominate the top five, which is only right, seeing as hockey was born in Canada. But for the first time since 1998, three of the NHL's top five most valuable teams are Canadian. All of the Canadian teams rank in the top 16 of the 30 team league. Hockey is Canada's religion and this surge in value for their teams boosts ticket prices north of the border that are already the highest in the NHL.
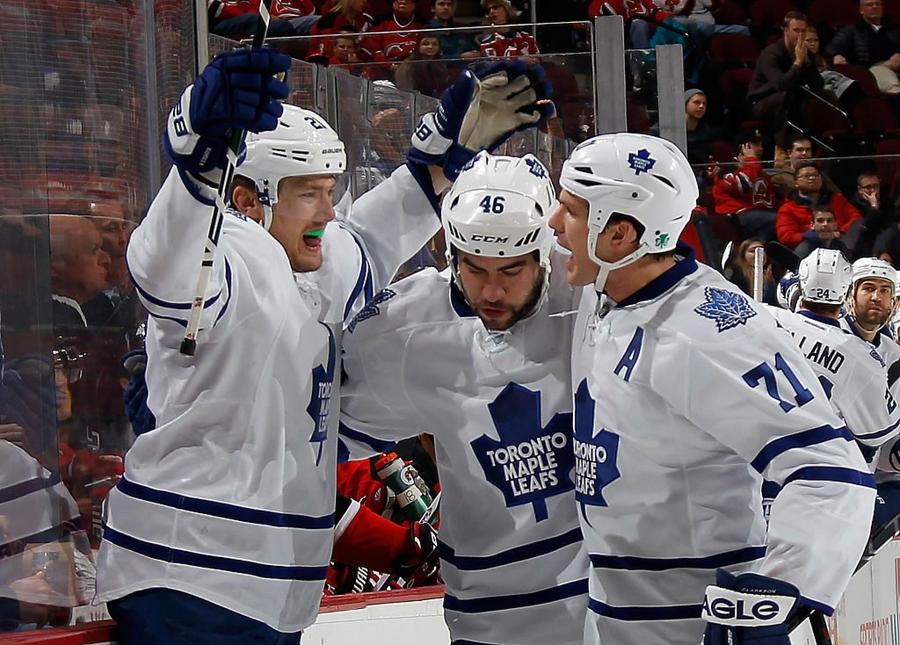
Most Valuable Hockey Teams / Bruce Bennett/Getty Images
In the 2012-2013 season, six of the seven Canadian teams set their average ticket price at $70. The NHL average is $64. The five most expensive ticket prices in the league are all Canadian teams –Toronto ($120), Montreal ($99), Winnipeg Jets ($95), Vancouver ($90), and Edmonton Oilers ($79). In the NHL ticket revenues are incredibly important as the home team keeps 100% of the gate money. The top teams in gate revenue last year were Toronto ($2.2 million), Montreal ($2.1 million), Vancouver ($1.8 million), New York Rangers ($1.8 million), with the Calgary Flames and Edmonton Oilers tied at ($1.6 million).
Small market Canadian teams do much better financially than small market American teams. The Edmonton Oilers, for example, are one of the financially strongest teams in the NHL, whereas the Florida Panthers almost have to give their tickets away for free and post an operating loss.
Canada's six-year, $600 million TV deal with CBC expires at the end of the 2013-2014 season. Renewal of that deal was sold to Rogers Communications for $5.3 billion over 12 years, starting next season. whether with CBC exclusively or in conjunction with TSN and Rogers Sportsnet—could go for $200 million per season. For comparison, the NHL's American TV deal is a 10-year, $187 million a season deal with NBC Sports that started in the 2011-2012 season. Obviously, richer television contracts mean a bigger increase in revenue. Let's take a look at the most valuable NHL teams:
- 1. Toronto Maple Leafs
- Team value: $1.1 billion
- Revenue 2012-13: $142 million
- Operating income 2012-13: $48.7 million
- Stanley Cup Titles: 13 – 1918, 1922, 1932, 1942, 1945, 1947, 1948, 1949, 1951, 1962, 1963, 1964, 1967
- 2. New York Rangers
- Team value: $850 million
- Revenue 2012-13: $131 million
- Operating income 2012-13: $27.3 million
- Stanley Cup Titles: 4 – 1928, 1933, 1940, 1994
- 3. Montreal Canadiens
- Team value: $775 million
- Revenue 2012-13: $127 million
- Operating income 2012-13: $29.6 million
- Stanley Cup Titles: 24 – 1916, 1924, 1930, 1931, 1944, 1946, 1953, 1956, 1957, 1958, 1959, 1960, 1965, 1966, 1968, 1969, 1971, 1973, 1976, 1978, 1979, 1986, 1993
- 4. Vancouver Canucks
- Team value: $700 million
- Revenue 2012-13: $101 million
- Operating income 2012-13: $15.8 million
- Stanley Cup Titles: 0
- 5. Chicago Blackhawks
- Team value: $625 million
- Revenue 2012-13: $115 million
- Operating income 2012-13: $25.6 million
- Stanley Cup Titles: 5 – 1934, 1938, 1961, 2010, 2013
- 6. Boston Bruins
- Team value: $600 million
- Revenue 2012-13: $114 million
- Operating income 2012-13: $18.5 million
- Stanley Cup Titles: 6 – 1929, 1939, 1941, 1970, 1972, 2011
- 7. Philadelphia Flyers
- Team value: $500 million
- Revenue 2012-13: $95 million
- Operating income: 2012-13: $6.0 million
- Stanley Cup Titles: 2 – 1974, 1975
- 8. Pittsburgh Penguins
- Team value: $480 million
- Revenue 2012-13: $107 million
- Operating income 2012-13: $20.9 million
- Stanley Cup Titles: 3 – 1991, 1992, 2009
- 9. Detroit Red Wings
- Team value: $470 million
- Revenue 2012-13: $96 million
- Operating income 2012-13: $10.5 million
- Stanley Cup Titles: 11 – 1936, 1937, 1943, 1950, 1952, 1954, 1955, 1997, 1998, 2002, 2008
- 10. Los Angeles Kings
- Team value: $450 million
- Revenue 2012-13: $98 million
- Operating income 2012-13: $8.2 million
- Stanley Cup Titles: 1 – 2012
- 11. Calgary Flames
- Team value: $420 million
- Revenue 2012-13: $420 million
- Operating income 2012-13: $11.5 million
- Stanley Cup Titles: 1 – 1989
- 12. Washington Capitals
- Team value: $414 million
- Revenue 2012-13: $83 million
- Operating income 2012-13: $8.0 million
- Stanley Cup Titles: 0
- 13. San Jose Sharks
- Team value: $405 million
- Revenue 2012-13: $84 million
- Operating income 2012-13: $2.1 million
- Stanley Cup Titles: 0
- 14. Edmonton Oilers
- Team value: $400 million
- Revenue 2012-13: $80 million
- Operating income 2012-13: $10.3 million
- Stanley Cup Titles: 5 – 1984, 1985, 1987, 1988, 1990
- 15. Ottawa Senators
- Team value: $380 million
- Revenue 2012-13: $83 million
- Operating income 2012-13: $6.8 million
- Stanley Cup Titles: 4 -1920, 1921, 1923, 1924
- 16. Winnipeg Jets
- Team value: $340 million
- Revenue 2012-13: $79 million
- Operating income 2012-13: $6.3 million
- Stanley Cup Titles: 0
- 17. Colorado Avalanche
- Team value: $337 million
- Revenue 2012-13: $67 million
- Operating income: $0.3 million
- Stanley Cup Titles: 2 – 1996, 2001
- 18. Dallas Stars
- Team value: $333 million
- Revenue 2012-13: $79 million
- Operating income 2012-13: $1.6 million
- Stanley Cup Titles: 1 – 1999
- 19. Minnesota Wild
- Team value: $330 million
- Revenue 2012-13: $81 million
- Operating loss 2012-13: $13.6 million
- Stanley Cup Titles: 0
- 20. New Jersey Devils
- Team value: $320 million
- Revenue 2012-13: $78 million
- Operating loss 2012-13: $4.2 million
- Stanley Cup Titles: 3 – 1995, 2000, 2003
- 21. Anaheim Ducks
- Team value: $300 million
- Revenue 2012-13: $73 million
- Operating loss 2012-13: $3.9 million
- Stanley Cup Titles: 1 – 2007
- 22. Buffalo Sabres
- Team value: $250 million
- Revenue 2012-13: $76 million
- Operating loss 2012-13: $1.0 million
- Stanley Cup Titles: 0
- 23. Florida Panthers
- Team value: $240 million
- Revenue 2012-13: $69 million
- Operating loss 2012-13: $7.7 million
- Stanley Cup Titles: 0
- 24. Nashville Predators
- Team value: $205 million
- Revenue 2012-13: $71 million
- Operating loss 2012-13: $0.8 million
- Stanley Cup Titles: 0
- 25. Phoenix Coyotes
- Team value: $200 million
- Revenue 2012-13: $67 million
- Operating loss 2012-13: $8.9 million
- Stanley Cup Titles: 0
- 26. New York Islanders
- Team value: $195 million
- Revenue 2012-13: $61 million
- Operating loss 2012-13: $1.2 million
- Stanley Cup Titles: 4 – 1980, 1981, 1982, 1983
- 27. Carolina Hurricanes
- Team value: $187 million
- Revenue 2012-13: $71 million
- Operating loss 2012-13: $3.4 million
- Stanley Cup Titles: 1 – 2006
- 28. St. Louis Blues
- Team value: $185 million
- Revenue 2012-13: $72 million
- Operating loss 2012-13: $2.5 million
- Stanley Cup Titles: 0
- 29. Tampa Bay Lightning
- Team value: $180 million
- Revenue 2012-13: $72 million
- Operating loss 2012-13: $5.4 million
- Stanley Cup Titles: 1 – 2004
- 30. Columbus Blue Jackets
- Team value: $175 million
- Revenue 2012-13: $69 million
- Operating income 2012-13: $4.9 million
- Stanley Cup Titles: 0